Get ready to dive into the fascinating world of New York City’s subway ridership! One of our most popular open dataset releases this year was the publication of Subway Hourly Ridership, which allows any member of the public to explore paid ridership at each of MTA’s station complexes by hour. In a city that never sleeps, this dataset provides a front-row seat to the ebb and flow of commuters and adventurers, letting you peek behind the curtain of the iconic NYC subway system. There are so many possibilities for how to use this data, and in this blog post we explore the impact of three major, classic New York City events on 2023 subway ridership: the NYC Pride March, the US Open, and the New York City Marathon.
The NYC Pride March
The NYC Pride March is an iconic celebration of the LGBTQ+ community that takes place annually at the end of June. The march is one of the largest pride events in the world and the largest in the United States; according to organizers, 2023’s march, which took place on June 25, consisted of 75,000 marchers and around 2 million spectators. This year’s march started at 26 St and 5 Av and ended in the Chelsea neighborhood of Manhattan at the corner of 15 St and 7 Av.
We can drill into how the march impacted subway ridership by looking at the nearby 23 St station on the line. Typically, every Sunday in June witnesses a dip in ridership at the 23 St station. However, on Sunday, June 25, the trend was interrupted. Data shows a noticeable increase in ridership compared to other Sundays in the month.
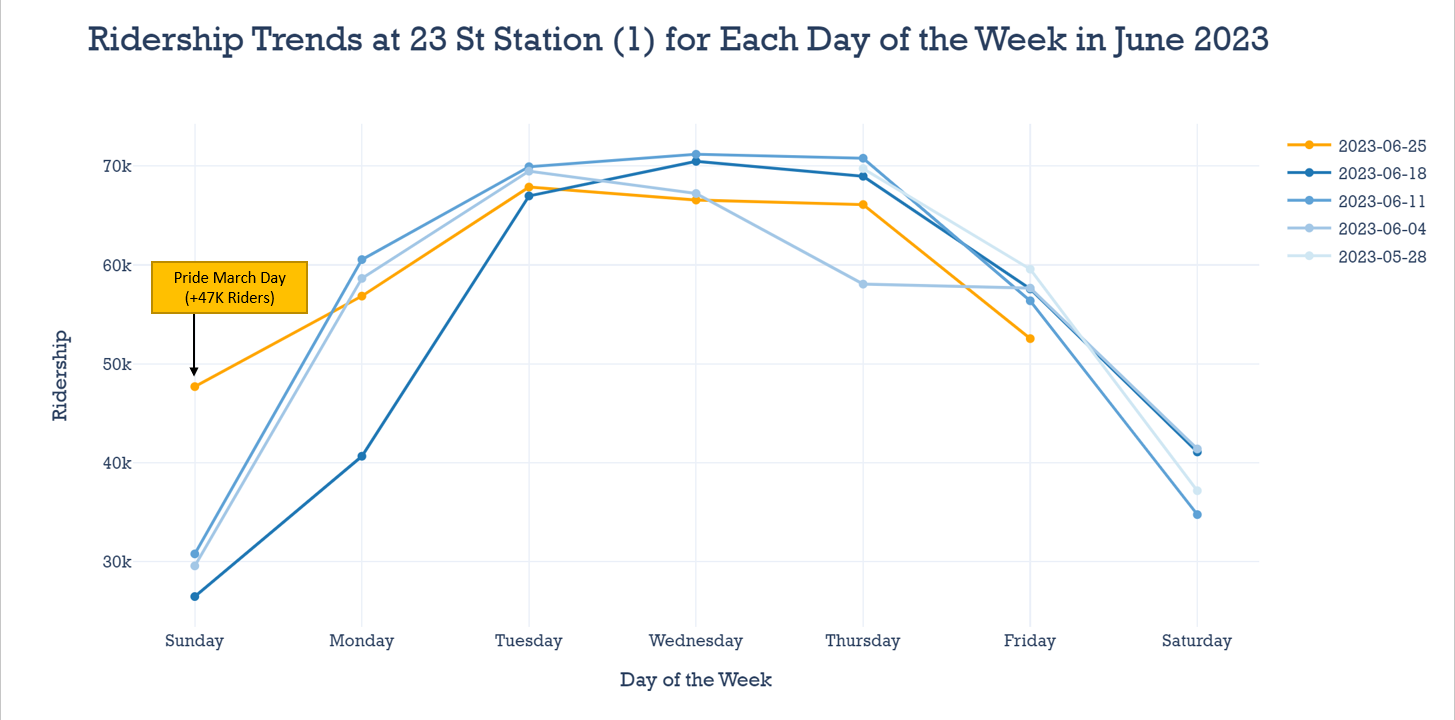
Figure 1: The graph shows a consistent pattern across all weeks where ridership peaks around midweek and declines through the weekend. On Pride March day there was an increase of approximately 15,000 trips compared to previous Sundays of June 2023. This substantial increase in traffic due to the Pride March festivities, highlighting the event's influence on subway ridership at 23 St (1).
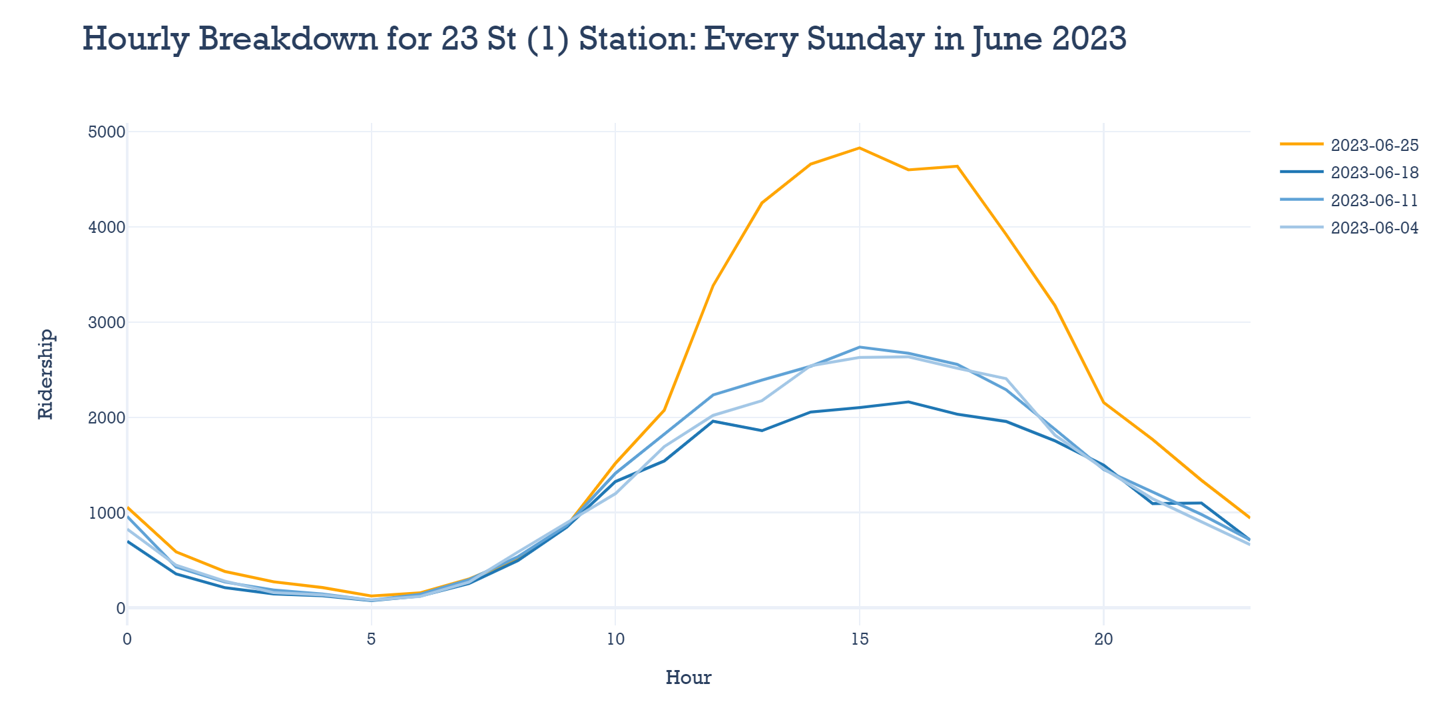
Figure 2: On Pride March day, the event began around 12 noon. Peak ridership occurred midday when it attracted the largest crowd between 11 a.m. and 8 p.m. Also, the graph illustrates a decrease in ridership as the day progressed into the evening, suggesting a steady dispersal of attendees as the event concluded.
The US Open
The US Open Tennis Championships takes place annually in Queens, New York. The venue, named the USTA Billie Jean King National Tennis Center, is in Corona Park and is conveniently accessed by subway via the line using the Mets-Willets Point station. The US Open takes place over a two-week period starting at the end of August and has a clear impact on subway ridership.
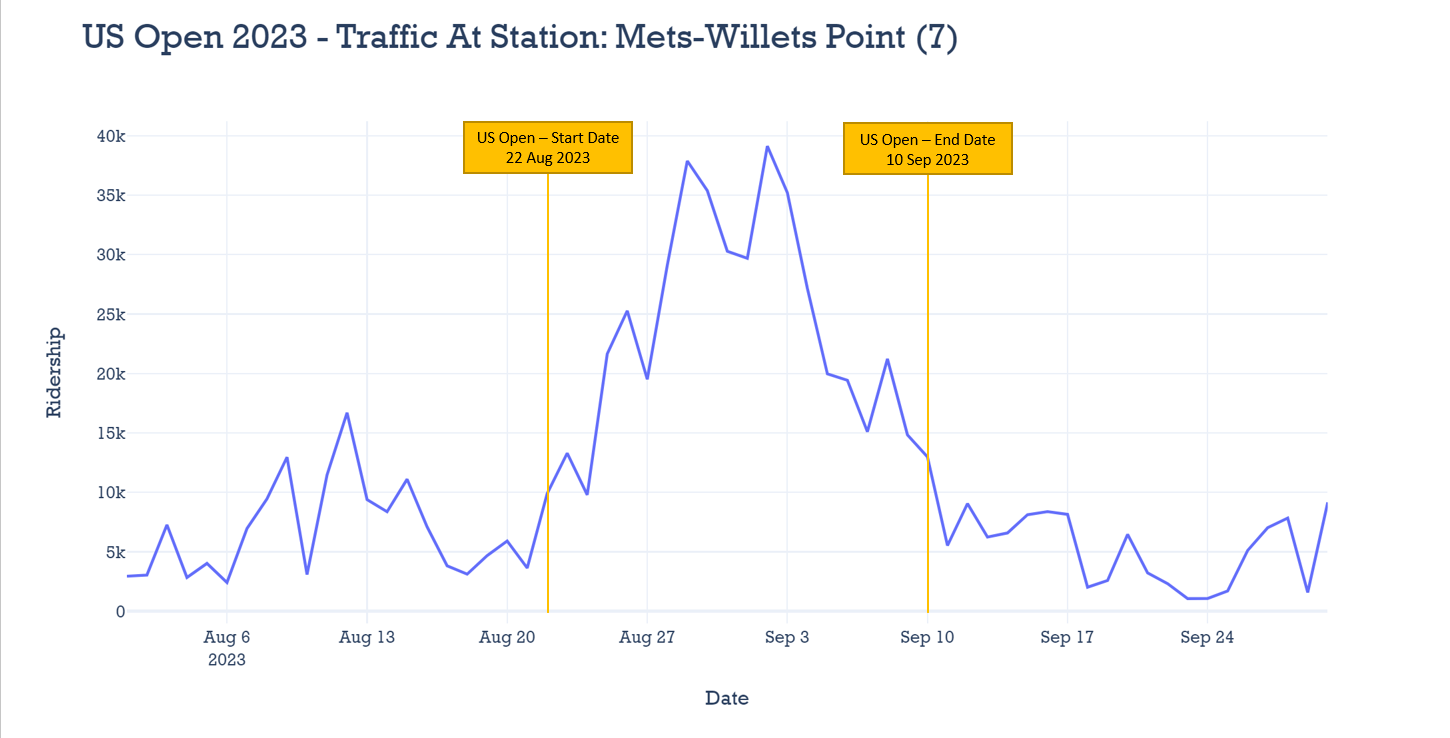
Figure 3: Around late August, ridership peaks near 40,000 riders a day. Post-August, the numbers stabilize and level out, averaging between 5,000 to 15,000 by mid-September when the US Open concludes.
We can zoom in even closer to the highest peak of the US Open subway ridership on September 2.
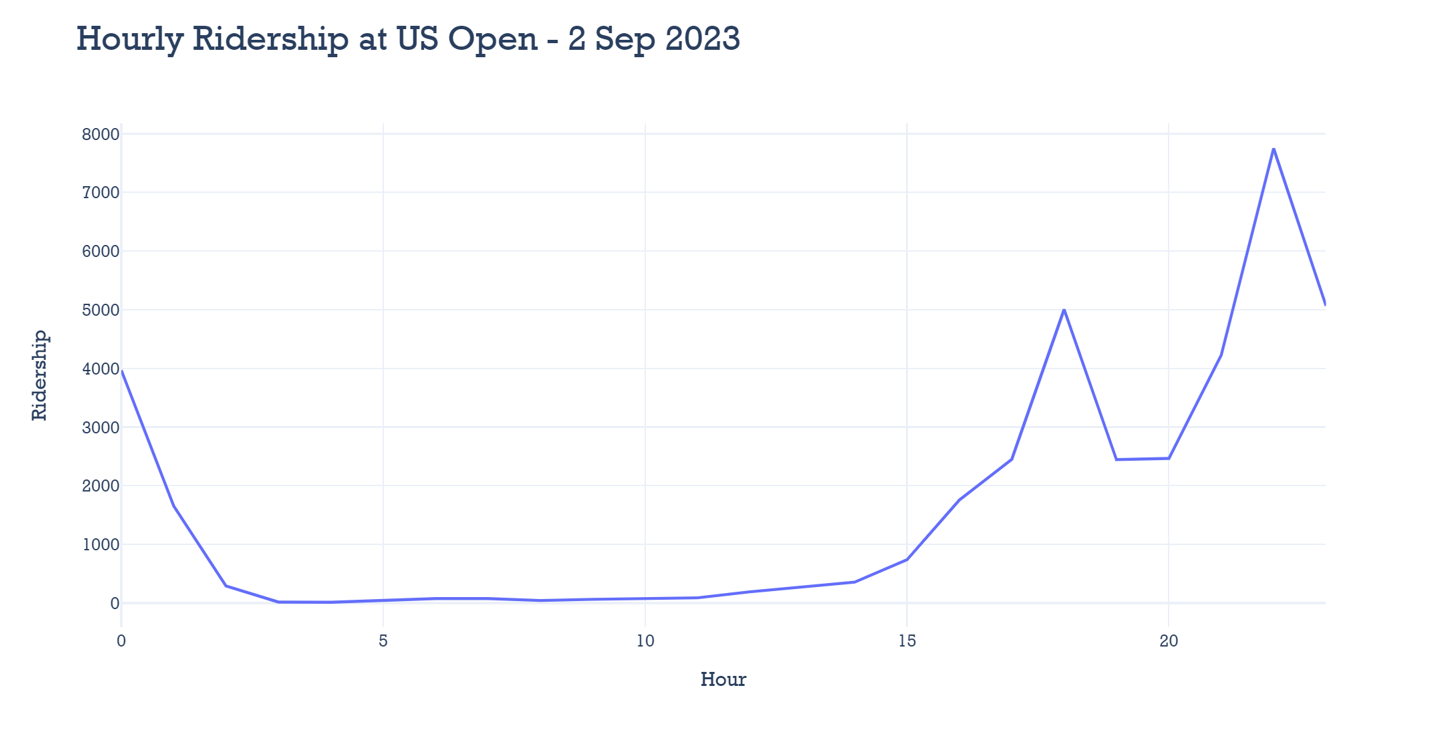
Figure 4: At 10 p.m. there is a pronounced peak in ridership, aligning with the end of the 7 p.m. matches (half of the 7 p.m. matches ended around the three-hour mark). Neat to see how the timing of the matches themselves get reflected in the ridership data!
The New York City Marathon
The New York City Marathon is the largest marathon in the world. It takes place annually on the first Sunday in November. The course takes runners through all five boroughs and starts by runners crossing from Staten Island to Brooklyn on the Verrazzano-Narrows bridge, which is typically only open for vehicular traffic. In 2023, the marathon boasted 51,000 runners crossing the iconic finish line in southwestern Central Park.
According to the course exit map from New York Road Runners, the non-profit organizer of the race, runners are directed to exit the course on the Upper West Side. For those taking the subway after the race, 72 St , 66 St-Lincoln Center , and 59 St-Columbus Circle are the closest subway stops, and this is clearly reflected in the ridership data.
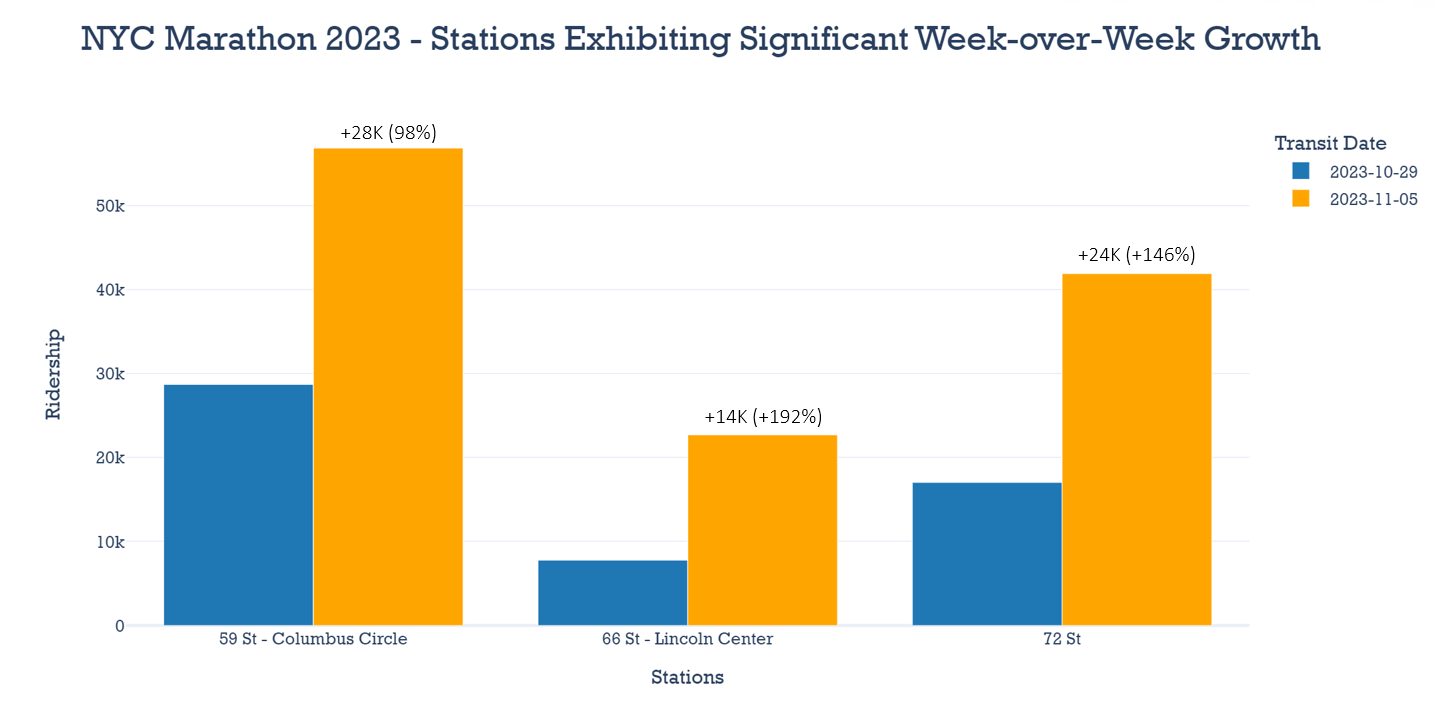
Figure 5: Columbus Circle was a major hub for spectators and participants leaving the race. There were approximately 28,000 additional riders on the date of the NYC Marathon in 2023 compared to the previous Sunday. Neighboring stations, 66 St-Lincoln Center and 72 St, also show notable increases in ridership. These stations experienced heightened transit activity, likely due to their proximity to the finish line of the marathon route.
In our data, we are also able to distinguish between riders who paid with OMNY, the MTA’s contactless fare payment system, versus MetroCard. OMNY set a new record on marathon Sunday, with 56.2% of all rides paid via the tap-and-go system. We can zoom in to one of the stations that experienced the most growth on Sunday, 72 St , and observe how OMNY was the preferred payment method for runners and the crowd.
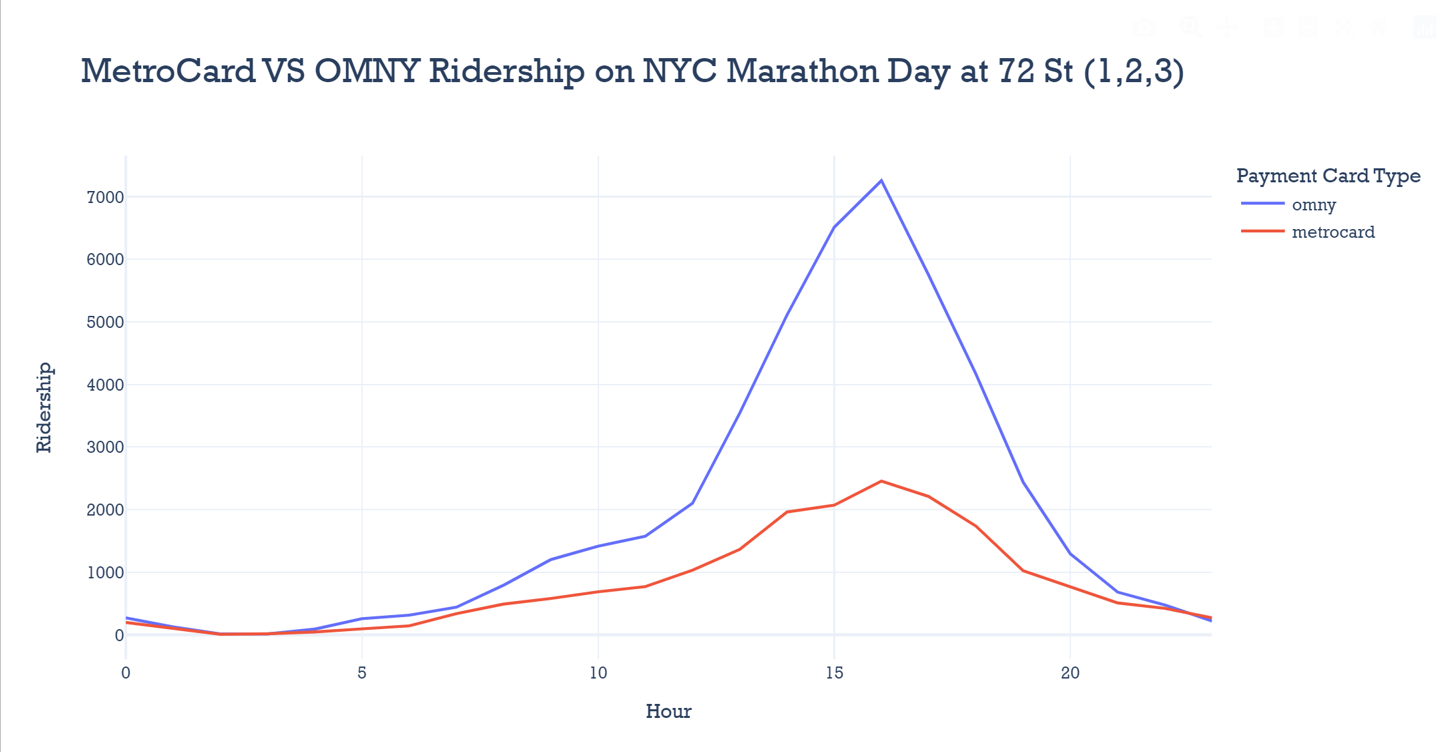
Figure 6: During the busiest hour, we can notice OMNY adoption at its peak, indicating a preference for contactless payment. MetroCard interactions experienced a more subdued and steadier climb, peaking at roughly 35% of paid ridership at the busiest point in the day.
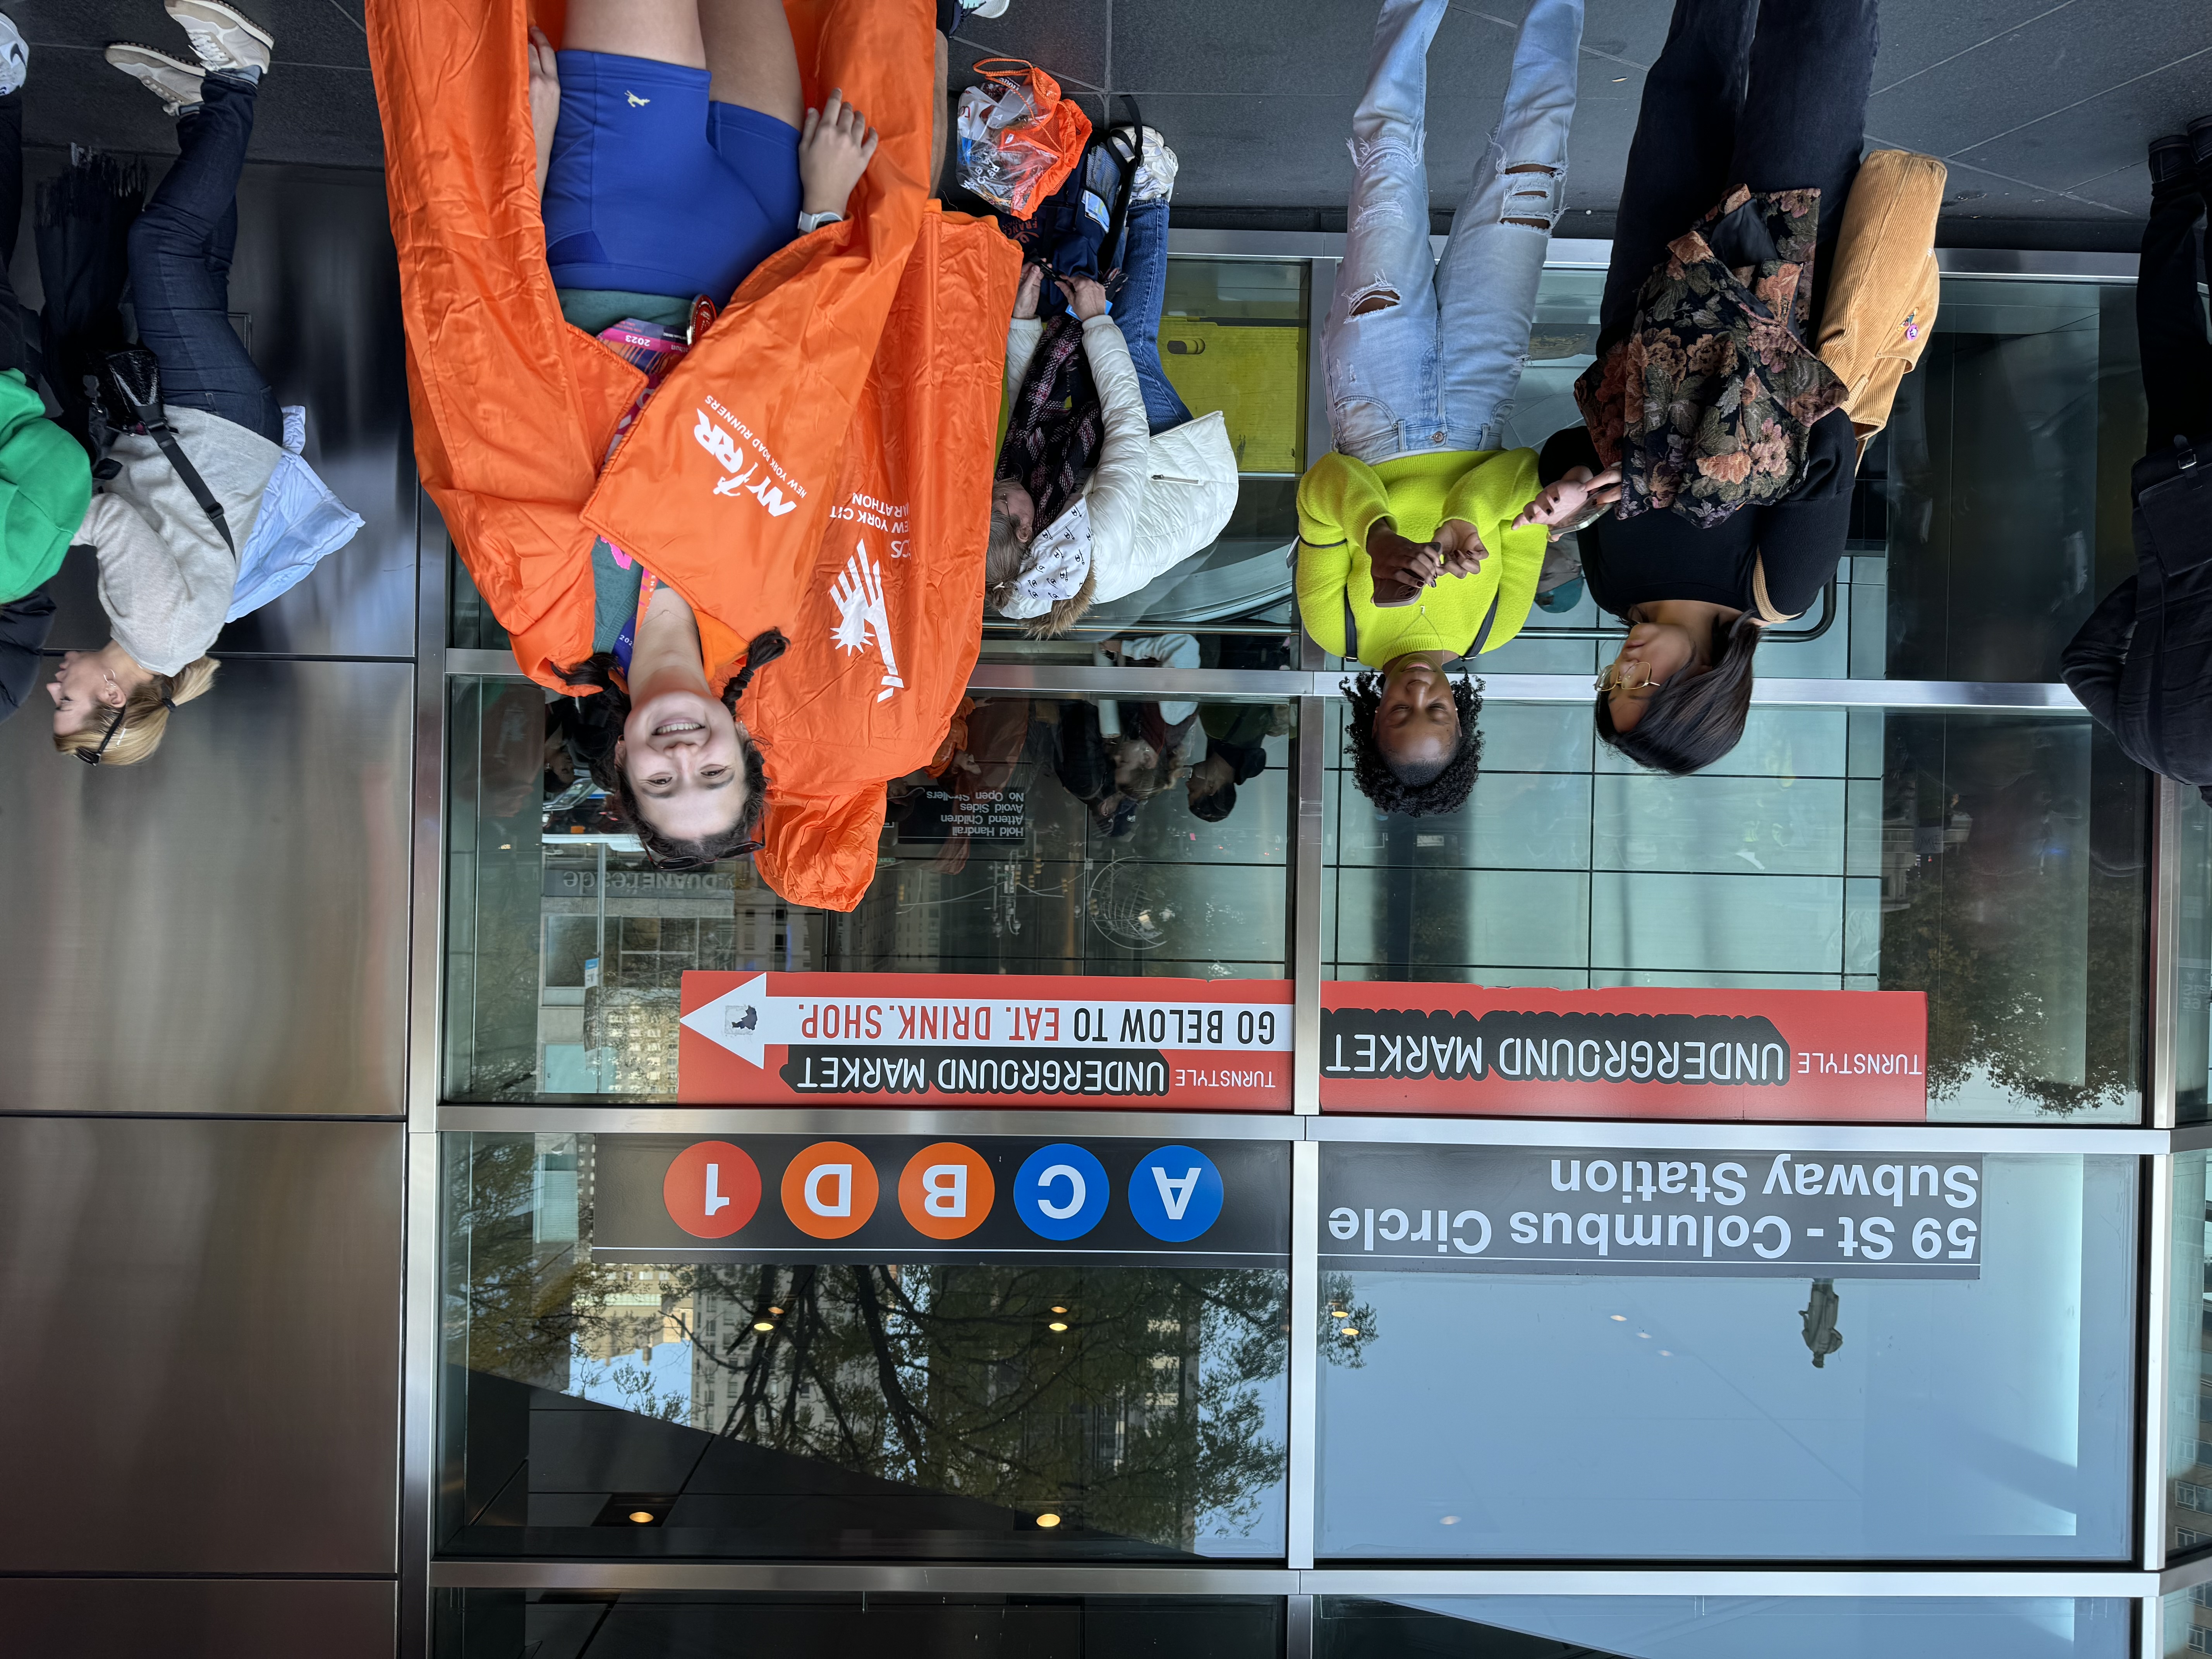
One of the co-authors, Lisa, before tapping in at the 59 St-Columbus Circle station after the race. She can confirm that the train was packed!
We hope you’ve enjoyed this glimpse into three iconic New York City events and their impact on subway ridership! If you are interested in making the charts displayed in this post yourself, or even analyzing an event of your choosing from 2023, check out our Subway Hourly Ridership dataset on our Open Data portal.
In this post, we used the open-source Python libraries Pandas and Plotly to create the visuals. If you make something cool with our data, using these tools or others, we’d love to hear from you! Email the open data team at opendata@mtahq.org.
About the authors
Antonita Racheal is a post-graduate intern with the Data & Analytics team, specializing in MTA ridership data.
Lisa Mae Fiedler is a manager on the Data & Analytics team, leading the MTA’s Open Data Program.